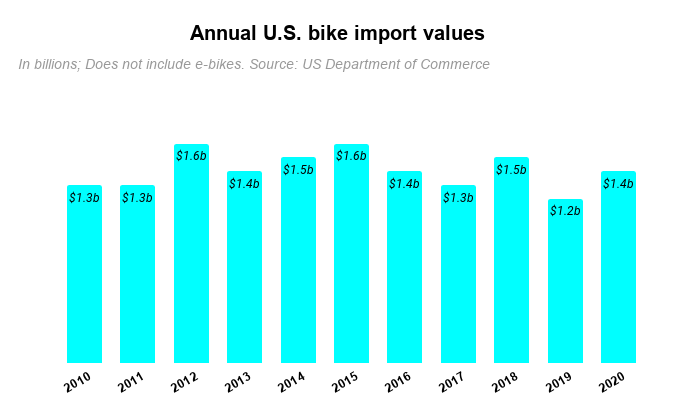
WASHINGTON (BRAIN) — The U.S. imported $1.4 billion worth of non-electric bikes last year, up $200 million, or 16%, from 2019. By units, bike imports were up 31.9%. Imports of some other key bike products like tires, tubes, and saddles, were also up significantly from 2019 figures. The figures were released by the U.S. Department of Commerce on Friday.
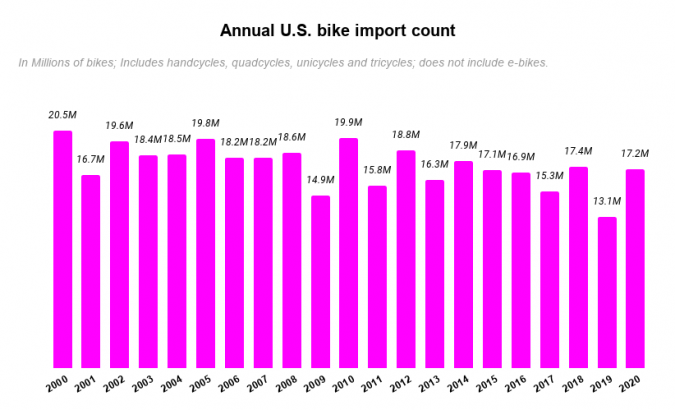
While sales and demand were exceptional in 2020, the import figures are not. The year-over-year increase of 16% is notable only because 2019 imports were exceptionally small (the lowest in 20 years likely due to uncertainly about tariffs on Chinese imports). Since 2020 imports started very slow in the first quarter due to coronavirus bottlenecks in Asia, the full-year 2020 import totals are not exceptional compared to recent years. For the dollar value of non-electric bicycles, 2020 was just the fifth-largest year since 2010.
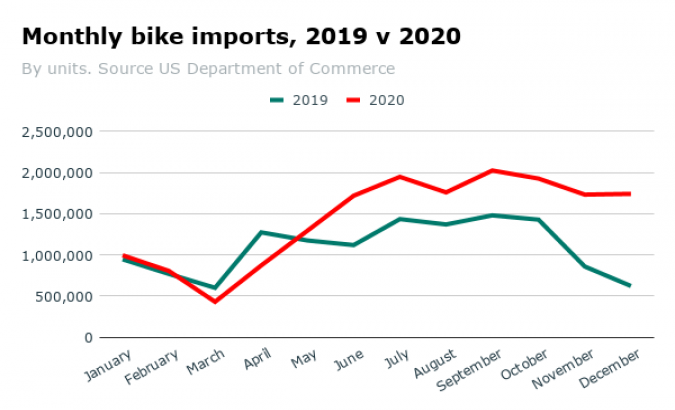
While the full-year numbers aren't exceptional, the Q4 figures were as the industry departed from its usual year-end decline. Compared to 2019’s last quarter, 2020 imports were up 86%. In December 2020, the industry imported 1.7 million bikes — 180% more than the 621,000 imported in December 2019.
Retail sales of bikes and other bike products were up by 50% and more in most categories, meaning both suppliers and retailers emptied their warehouses and backrooms and are still far from replenishing them or even fulfilling orders in most cases. With little talk of increasing production capacity, inventories likely won't return to normal until mid-2022. 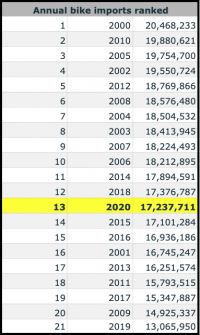
Parts shortages
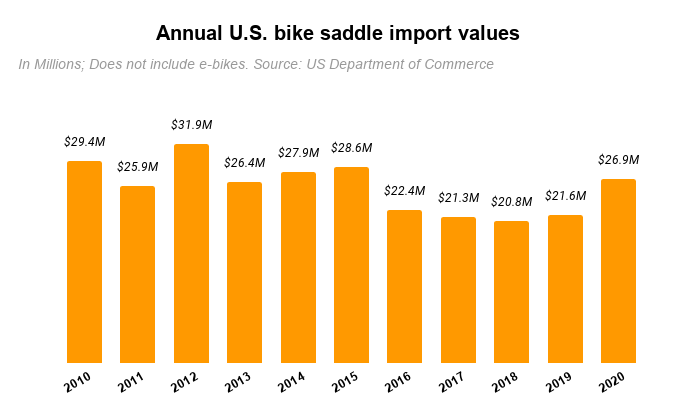
Parts have been in short supply this year, both for retail repairs, aftermarket upgrades, and for bike makers. Most parts manufactured, of course, go to bike factories, not aftermarket distributors. For example, last year the U.S. imported 9.6 million aftermarket tires and 2.8 million aftermarket saddles. But we also imported 17 million bikes, presumably with 17 million saddles and 34 million tires installed. Inner tubes are an exception to the usual aftermarket/OE ratio: the U.S. brought in 29.1 million aftermarket tubes last year, compared to the 34 million tubes included with bikes.
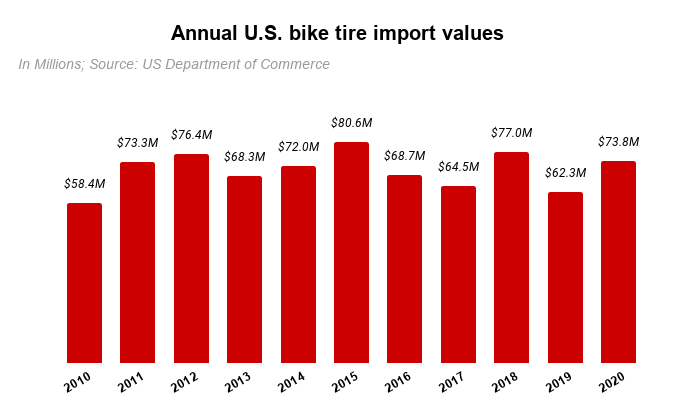
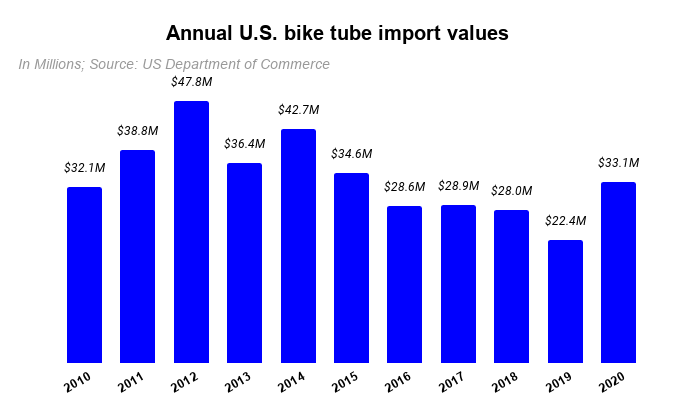
Speaking of tubes, imports in that department blew up in 2020, increasing 47% in value compared to 2019, as distributors and retailers scrambled to find all the butyl they could get. Historically, however, the full-year import value was not exceptional: 2020 was just the 6th biggest year since 2010 in terms of inner tube import values.
Here are a few charts and pretty picture of a ship that tell the story:
