BELLINGHAM, Wash. (BRAIN) — 99Spokes.com co-founder Scott Alexander quickly concedes that entrepreneurs, hobbyists, and large corporations have been building bike product databases at least since the days of CD-ROMs, if not earlier.
"There have been many, many, of them over the years," said Alexander, whose day job is at a software company. He and two partners began developing 99Spokes, a database of bike models, about three years ago.
So what makes 99Spokes different from its predecessors?
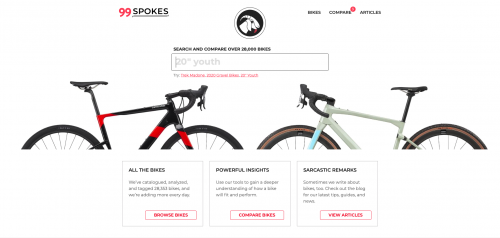
There are really just two factors: the volume of information and the ease of accessing and analyzing it. 99Spokes has a database of detailed information for more than 27,000 bike models, including prices, specs, gear charts, frame geometry for all sizes, photos, and more.
The information goes back several years.
99Spokes built software tools allowing it to quickly scrape the information from brands' websites, and it's always adding more.
"Many similar tools have existed over the years, but none have amassed a data set as large or complete as ours," Alexander said.
The bike specs can be sorted and filtered to compare models and identify alternatives.
 A powerful scatter plot tool shows chosen bike models by price and spec relative to other similar options. All the dots on the plot are clickable, allowing users to quickly go through options. To make the specification access work in the plot, 99Spokes developed a tool that weights the component specs by perceived quality across brands.
A gearing chart lets users see and compare each model's gear range, showing the speeds that would be attained spinning at 100 rpms in each gear. Users can insert their current bike's gearing to compare. An interactive geometry drawing overlay feature allows users to compare frame dimensions of different models and sizes.
The database is intended to be useful to consumers, retailers, and suppliers. Canyon Bicycles has been working with 99Spokes for about a half a year, using its tools to do competitive market analysis.
"We've also seen our tool in use on bike showroom floors," Alexander said. "Our geometry comparison feature enables you to draw the customer's current bike on top of the new bike they're considering. Having a drawing to point to really helps explanations of foreign terms like 'head tube angle' and 'reach' and how they relate to fit/handling."
Alexander got started on the project after crashing his bike and needing a new derailleur hanger. He soon grew frustrated with the information available and decided to build a better bike archive. He and his partners continue with their day jobs and work on the site nights, weekends, and lunch breaks.
Alexander said the site might ultimately be most useful to online bike shoppers who currently have to jump between various brand websites to compare models.
"The online shopping experience is pretty confusing, with consumers having to go to multiple sites. We want to be the resource for people for that. And along the way, we've developed all this data that could be useful for manufacturers and retailers," he said.
Currently, 99Spokes is not monetized, except the agreement with Canyon. Alexander said it eventually could include ads, including targeted ones allowing a brand to present ads to visitors who search the database for specific bike types or brands, for example.
"Our main priority now is getting more traffic on the site," Alexander said.
As of mid-July, 99Spokes was receiving only about 800 unique site visitors a day. Alexander said the site is not well ranked in Google results because of its relative lack of written content.
To improve search rankings Alexander is looking to establish backlinks with other sites. He is also working with editors to provide product comparison information for articles and features. For an example, see the mountain bike headtube angle chart in the BRAIN Dashboard in the August 1 issue of BRAIN. The chart is reprinted above.
A version of this article appeared first in the August 1 issue of BRAIN.


